Uncertainty comes in many forms both in the models economists build and analyze and in the real world. The models that we as economists build and analyze are highly stylized. These include “shocks,” random impulses such as technology shocks or monetary policy shocks that are transmitted over time. They are at best approximations because they ignore some forces and oversimplify others. (Put impolitely, our models are “wrong.”) In addition, we typically have multiple models at our disposal and are unsure how much credibility to assign to each. Data helps us to make this assessment, but evidence is typically only partially informative. While these challenges are familiar to applied researchers, similar challenges confront any decision maker who faces uncertainty including investors or policy makers. Individuals or decision-making entities have views or perspectives about the future that shape their actions. These views are necessary simplifications, and there may be multiple possible perspectives to be considered. The more complex the underlying environment is, the bigger the challenge for how best to confront the uncertainty in meaningful ways. Thus, when there are more environmental intricacies, there is greater scope of a broader approach to uncertainty that is important. Recent dynamic decision theory under uncertainty and a related control theory aim to provide tools to assess uncertainty broadly conceived. The research displayed in this paper and elsewhere aims to convert abstract insights into operational tools of analysis to enhance our understanding of how financial markets work and to provide more sober assessments of economic policy, or assessments that avoid false pretenses of knowledge that are too common in policy discussions.
This particular paper develops and applies specific tools to study how uncertainty, skepticism, and confidence can impact prices and quantities in financial markets. Imagine investors who are unsure about the future. They have at their disposal multiple views or models of the future, but they are not fully confident about any of these views. Moreover, these investors suspect that the structures of the models that express their views are in some ways flawed. The flaws themselves are unknown and thus not easily correctable in the near future. This perspective broadens the notion of uncertainty relative to the more familiar risk aversion paradigm that dominates economic analysis and discourse. It also adds richness to our understanding of the price of uncertainty and fluctuations in this price over time. In Prices of Macroeconomic Uncertainties with Tenuous Beliefs, we provide a formal analytical structure and offer a quantitative illustration that focuses on macroeconomic growth and its persistence. In our example economy, we confront investors with uncertainty about the future of macroeconomic growth in a stylized way. This uncertainty is meant to capture, say, the possibility but not the certainty of secular stagnation debated by macroeconomists, or the uncertainty about growth impacts of future technological advances debated by economic historians. In our quantified illustration, we find that prices of uncertainty fluctuate because investors especially fear high persistence of macroeconomic growth in bad states and fear low persistence in good ones. This mechanism induces an endogenous nonlinearity into the underlying asset valuations that we characterize. This nonlinearity compounds over time in ways that provide a novel explanation for how asset market fluctuations reflect uncertainty. What follows are two figures that illustrate how we can depict the objects in play when investors make decisions while juggling multiple models that express the views they want to entertain.
Suppose that investors start with a simple linear (first-order autoregressive) model of growth rate dynamics but that their concerns about uncertainty induces them to explore other statistically similar specifications including ones that they especially fear. The linear relation with the negative slope captures their baseline model with so-called mean reversion in growth rates. It displays is a continual pull toward the center of the growth rate distribution, perturbed by random shocks. The vertical axis is the local pull towards the center of the distribution of macroeconomic growth (net of its long run average growth rate.) Think of zero as the center point; in the absence of random shocks, there is pull towards zero. The kinked line in red emerges when our investors consider formally many other possible and statistically similar specifications and when they then compute another one that is feared but remains statistically similar to the linear model. The flatter slope to the left of zero reflect investors’ concern in bad economic times that the economy may be stuck with more growth sluggishness than in the original model. The steeper slope to the right of zero reflects just the opposite. The good macroeconomic growth outcomes may be shorter lived than in the original model specification. The blue and green curves show further adjustments induced by overall concerns that all of the models listed so far are wrong (misspecified). The overall downward shift occurs because the investors are averse to all of these different forms of uncertainty. While this discussion is heuristic, the paper develops these ideas including the connections to statistical perspectives in formal ways that are amenable to computation.
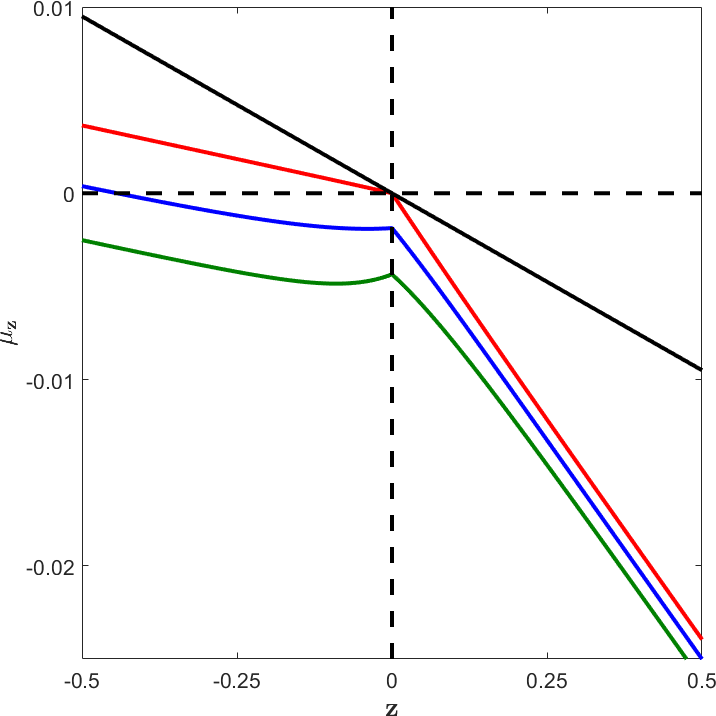
Figure 1: Local dynamics for macroeconomic growth. black:baseline linear model; red: most feared statistically similar model; blue and green incorporate concerns about model misspecification.
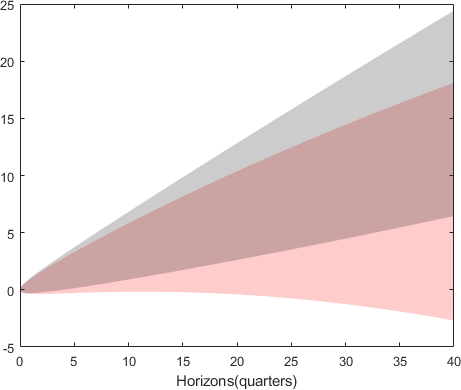
Figure 2: Distributions of consumption growth for alternative horizons. This plot includes distributions implied by the baseline model and most feared model inclusive of model misspecification concerns. The gray shaded area depicts the interval between the .1 and .9 deciles for every choice of the horizon under the baseline model. The red shaded area gives the region within the .1 and .9 deciles under the most feared statistically similar model.
While the first figure targets the local dynamics, the second one looks at how the implications are compounded over time by plotting deciles of the implied macro consumption distributions over alternative horizons. For sake of simplicity, we only depict the results comparing the base line black line to the distributions associated with the green curve. The gray region depicts the baseline distribution, and the red region shows the impact of the uncertainty adjustment obtained by twisting in a conservative direction indicative of more cautious decision making in the face of uncertainty.
Read the full paper here.